Opensea introducing new analytics tools
OpenSea is the largest and most popular NFT marketplace, which, by the end of 2021, occupied 90% of the market in terms of sales. Having occupied such a niche, it is impossible to maintain it without constant work and improvements. Most recently, they updated the entire site, which we wrote about in detail in the article Popular NFT Marketplace OpenSea Update! What’s new?
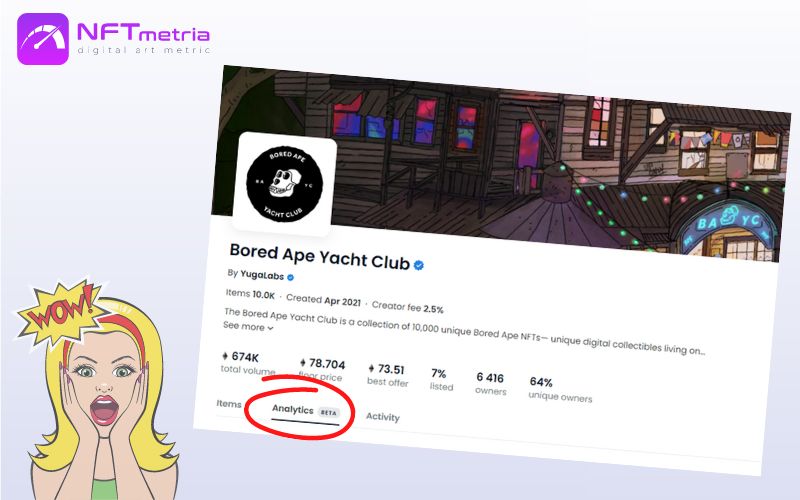
And today we see another update that no other marketplace has been able to implement to date. While the tools are available to a limited number of people in the Beta version, they are definitely very valuable. We have the opportunity now to review the main updates and give our expert assessment of the development of the project. Let’s take a closer look at the new Opensea analytics tools using the well-known Bored Ape Yacht Club collection as an example.
What are the new Opensea analytics tools about?
Opensea analytics tools touch on one of the most important parameters for an NFT investor in terms of historical data, namely the analytics of each NFT collection. Now inside each collection you can see the Analytics section, which presents:
- Volume,
- Sales,
- Floor price,
- Listings,
- Price Distribution,
- Owner Distribution,
- Owners aka whales.
So far, the Beta version contains only a short-term analysis of NFT historical data in the context of one, seven and thirty days with some infographics. Perhaps, in the final release, the developers will add functionality in the context of 90 days, last year and all time. For comparison, let’s mention the “Activity” section, which also has minimum sales analytics, but the shortest range is 90 days. Let’s now take a closer look at each option.
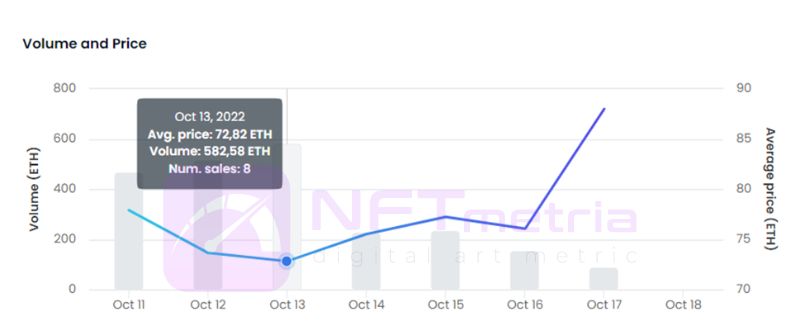
Volume
The volume of NFT sales was also implemented in the previous version in the Activity section. But it lacked the ability to analyze the last 24 hours, 7 and 30 days. The graph shows the average price, total sales and number of transactions on a specific date. Thus, we can analyze the investment attractiveness of the project in terms of these parameters for a selected period of time.
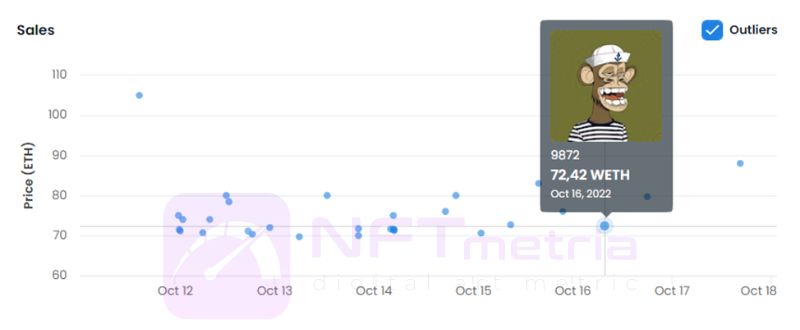
Sales
This is one of the most important new Opensea analytics tools. The module is presented in several versions, each of which gives a holistic view of sales from different angles.
- Listing all trades for the time period you selected in chronological order.
- Demonstration of the same transactions, taking into account the sale price. This chart allows us to analyze the actual sale of assets in terms of their cost and time.
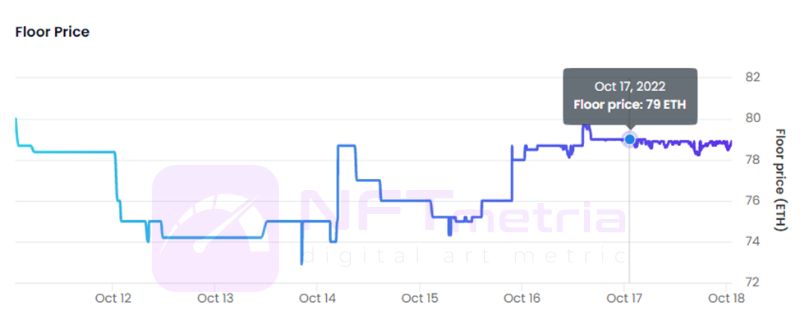
Floor price
The Floor price module on OpenSea is one of the most important factors that demonstrates the entry barrier for potential buyers and NFT collectors. This is presented as a graph with floor price visualization for the entire period of your choice in the context of each day.
Listings
All NFTs put up for sale during the specified period of time fall into the Listings module. The developers have implemented this module with the ability to sort:
- Low to high,
- High to low,
- More recent.
For each NFT, there is information on how much its price differs from the floor price. And immediately here you can add the NFT you like to your cart. This option also appeared quite recently in the latest update of OpenSea. Thus, we can analyze the real offers that come to the market.
Price Distribution
So, we have come to the most interesting modules, which were not previously presented even in a simplified form on any NFT marketplace.
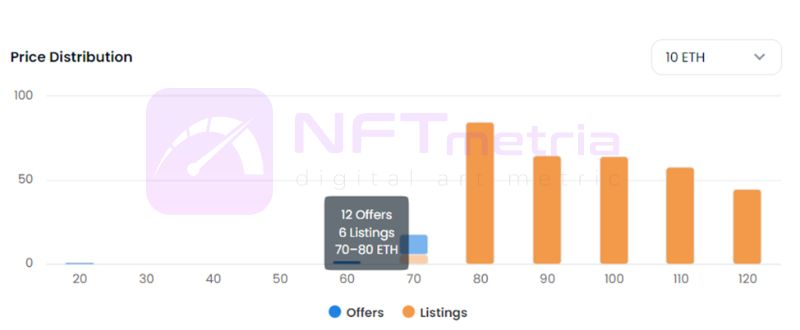
The Price Distribution module provides insight into the real situation of supply and demand in terms of price. That is, on the chart, we see that for less than 70 ETH, NFTs are not sold within the collection. But at the same time, there are several offers in the range of 60-70 ETH. And here is the real picture of Price Distribution within the collection: NFTs in the range of 80-130 ETH get on Listings. Given the floor price, in the previous screenshot, we see that the largest price sector for Listings comes from the floor price and plus 10 ETH.
Owner Distribution
Without previously having the Owner Distribution module inside the NFT collection, it was difficult for us to analyze the real distribution of tokens by the number of unique wallets. What have we seen before? Only the number and percentage of unique owners.
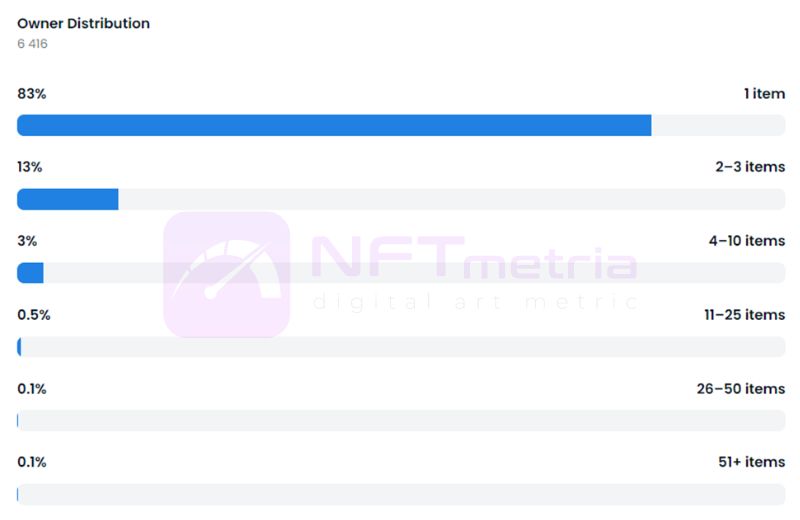
There are Owners – Whales, who are the owners of a large number of NFTs. The more of them and the amount of assets in their wallets, the less independent the collection becomes. With large volumes, they have the ability to manage liquidity and price in the market. Therefore, this module is of particular value and shows the distribution of tokens by owners depending on the amount on each wallet.
Owners
This is one of the most important new Opensea analytics tools. An even more interesting new module is Owners, which is a logical continuation of the previous module and makes it possible to look pointwise at the holders – whales. Above we described the importance of this data. Sometimes, in this way, you can find interesting patterns and dependencies that will help evaluate the investment attractiveness of the project and find various relationships.
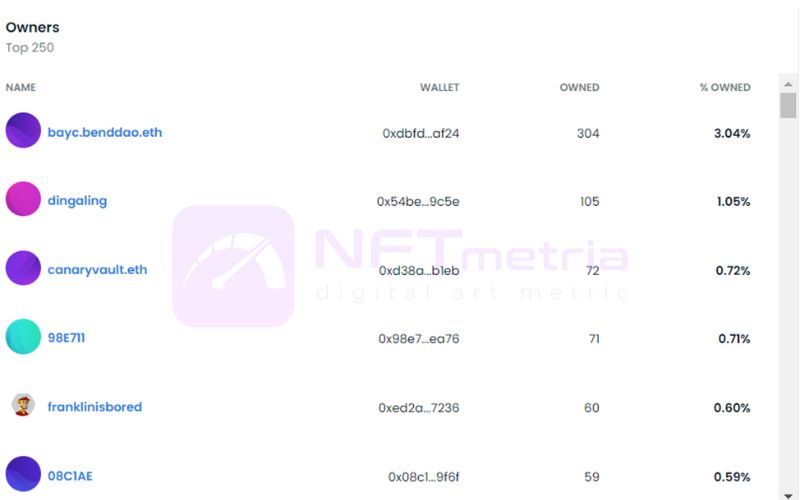
This module represents the Top 250 largest unique wallets within the collection with the ability to go to each of the specified wallets.
Opinion NFTMetria about Opensea analytics tools
NFT marketplace OpenSea is making a big leap ahead of its competitors with the launch of rarity tools and now with the introduction of Opensea analytics tools. Why is it important? Previously, it was necessary to use third-party, not always reliable resources for a similar analysis, and some of the data could only be obtained manually. This could significantly reduce the correctness of the analytical data used.
What’s next?
The OpenSea team plans to implement even more analytical modules, such as:
- Market capitalization,
- Tracking large holders,
- Deeper statistics and tracking by segments within the collection,
- Grouping of holders,
This is data that will help NFT collectors understand the trends within the collection in more detail. We just wrote about this in the article Investment valuation NFT: how to evaluate an NFT project?
Such innovations will allow the marketplace to occupy an increasing share of the market, attract new users due to the ease of use of each section of the site. In addition, the marketplace, by its actions, closes the full cycle of analytical data, thereby cutting off players from other related analytical areas.